College Basketball Handicapping System
The Spreadsheet – The Core Computations
There are extensive calculations required to develop the updated odds for nearly 200 Division I college basketball teams, most playing on a weekly basis. A master computer spreadsheet was created in Microsoft Excel to record each team’s results and the system’s power ratings.
With these spreadsheets, one can experiment and test any number of different handicapping scenarios. I have found this not only useful and informative,
but also very entertaining and creative.
Hopefully, many others will also find this so, and by using this format will also
find handicapping systems that suit them well.
Please consider this particular spreadsheet that all important one, the rock-solid
core for all successful handicapping. It’s unequivocally the number one essential
element for informed and effective handicapping – count on it!
Spreadsheet Description
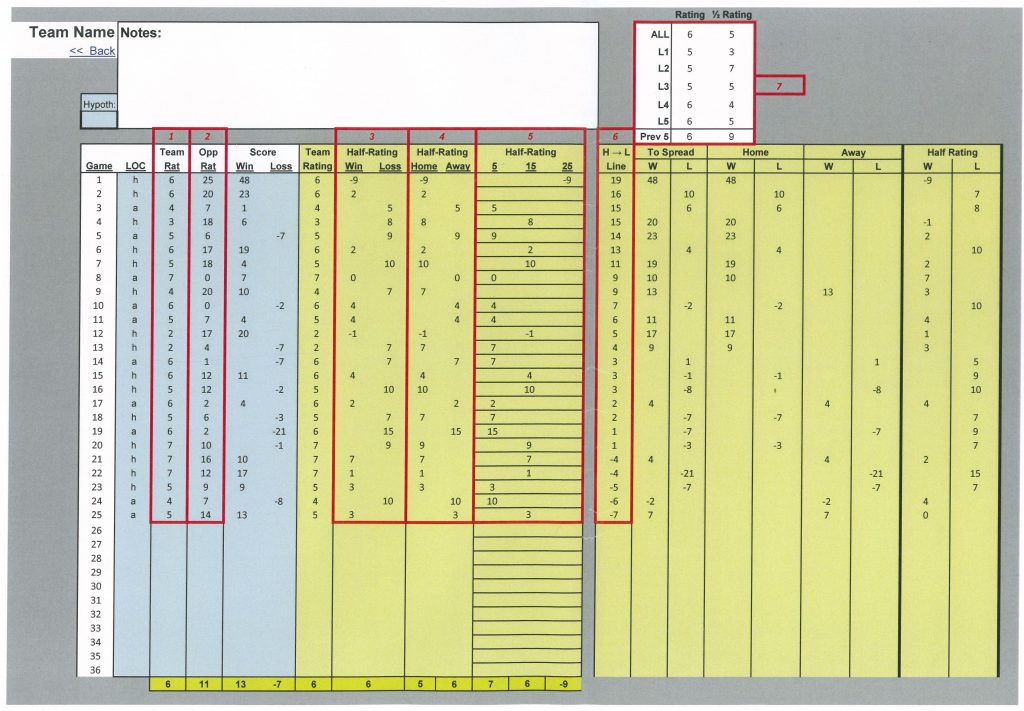
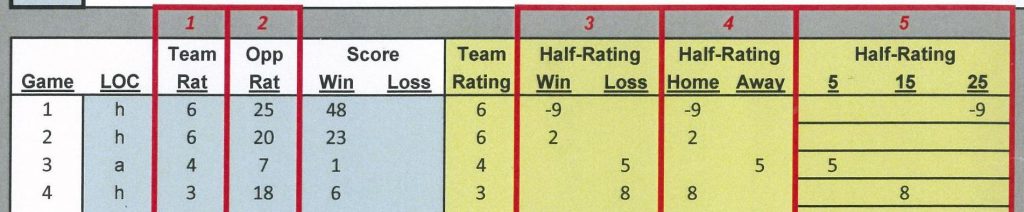
The following is a description of the different categories for the columns designated per the image above.
Columns 1 & 2
These are important columns listing the official Vegas ratings. Opp Rat. Is the opposition rating adjusted for home, natural or away courts. Team Rat. Versus Opp Rat. Equates to the official Vegas line. Armed with the information, a person can quickly observe the extent to which Vegas is adjusting their ratings and lines – to make up for recent wins/losses, i.e., momentum, trends. So-called “experts” have never before provided such valuable information in this particular form, and yet it is considered one of the more relevant elements when handicapping.
Column 3
I call this my “one half’ rating system for the following reason: If a team improves over the line, I credit its official Vegas rating by only one half of the amount improved. If a team performs worse than the line, I decrease its Vegas rating by only one half of that amount.
Please note – this calculated rating is only for that particular game. It is not the overall or average rating for that team.
In summary, these particular ratings are the most important components of my entire handicapping system and are the ones listed throughout this spreadsheet.
Column 4
Home and away ratings can sometimes vary significantly, and a good handicapper needs to have this relevant information.
Column 5
The ratings posted here tell you how a team is performing when it is playing against good teams (0-9 ratings), average teams (10-19 ratings), and poor teams (20+ ratings)
Column 6
These tables are popular since they show how a team is performing versus the line. However, the data in this column is sorted high to low and do not consider recent trends, so be careful here.
Column 7
This table addresses recent performance and momentum – a very useful table. Refer to my separate discussion on this subject.